• Opening Time : 8:00 AM - 8:00 PM

Tag: Data Visualisation

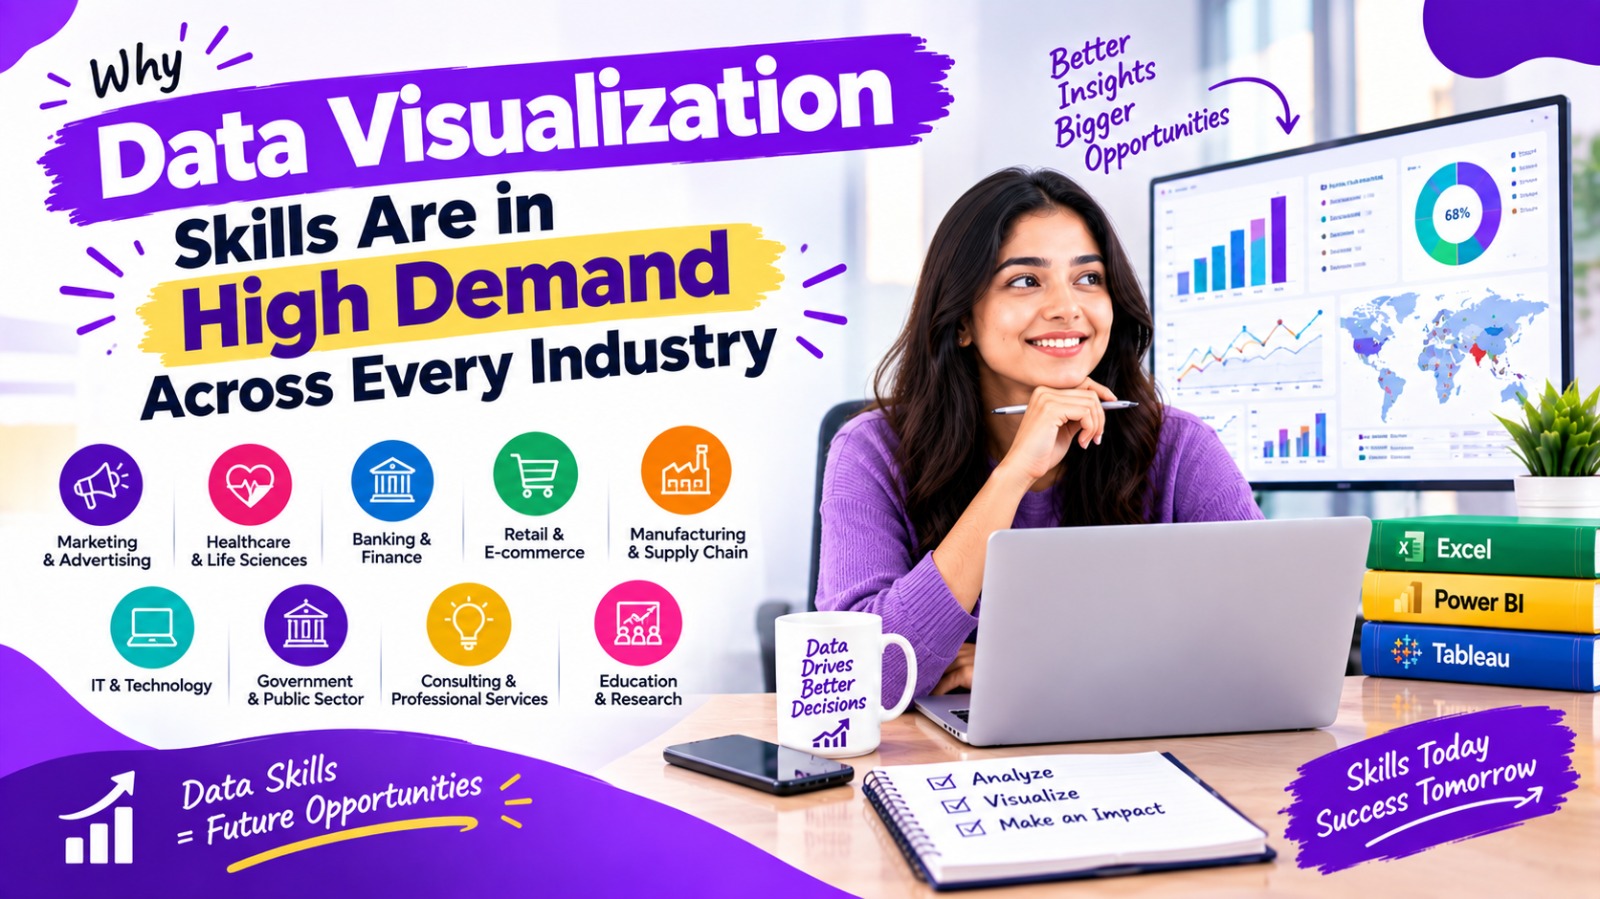
Why Data Visualization Skills Are in High Demand Across Every Industry

Businesses today generate and collect enormous amounts of data. Customer transactions, website visits, sales records, financial information, marketing performance, employee data, inventory levels, production statistics, healthcare information, and operational reports are continuously being created. But having data is not enough. The real challenge is understanding the data and communicating what it means. This is where […]

Data Visualization & Analytics Course in Ahmedabad: Build a Career with Excel, Power BI & Tableau

Businesses generate large amounts of data through sales, finance, marketing, customers, operations, websites, and other activities. Turning this data into useful information requires more than simply storing numbers in spreadsheets. Data analytics helps businesses examine data and identify patterns, trends, relationships, and insights, while data visualization helps communicate those insights through charts, reports, and dashboards. […]

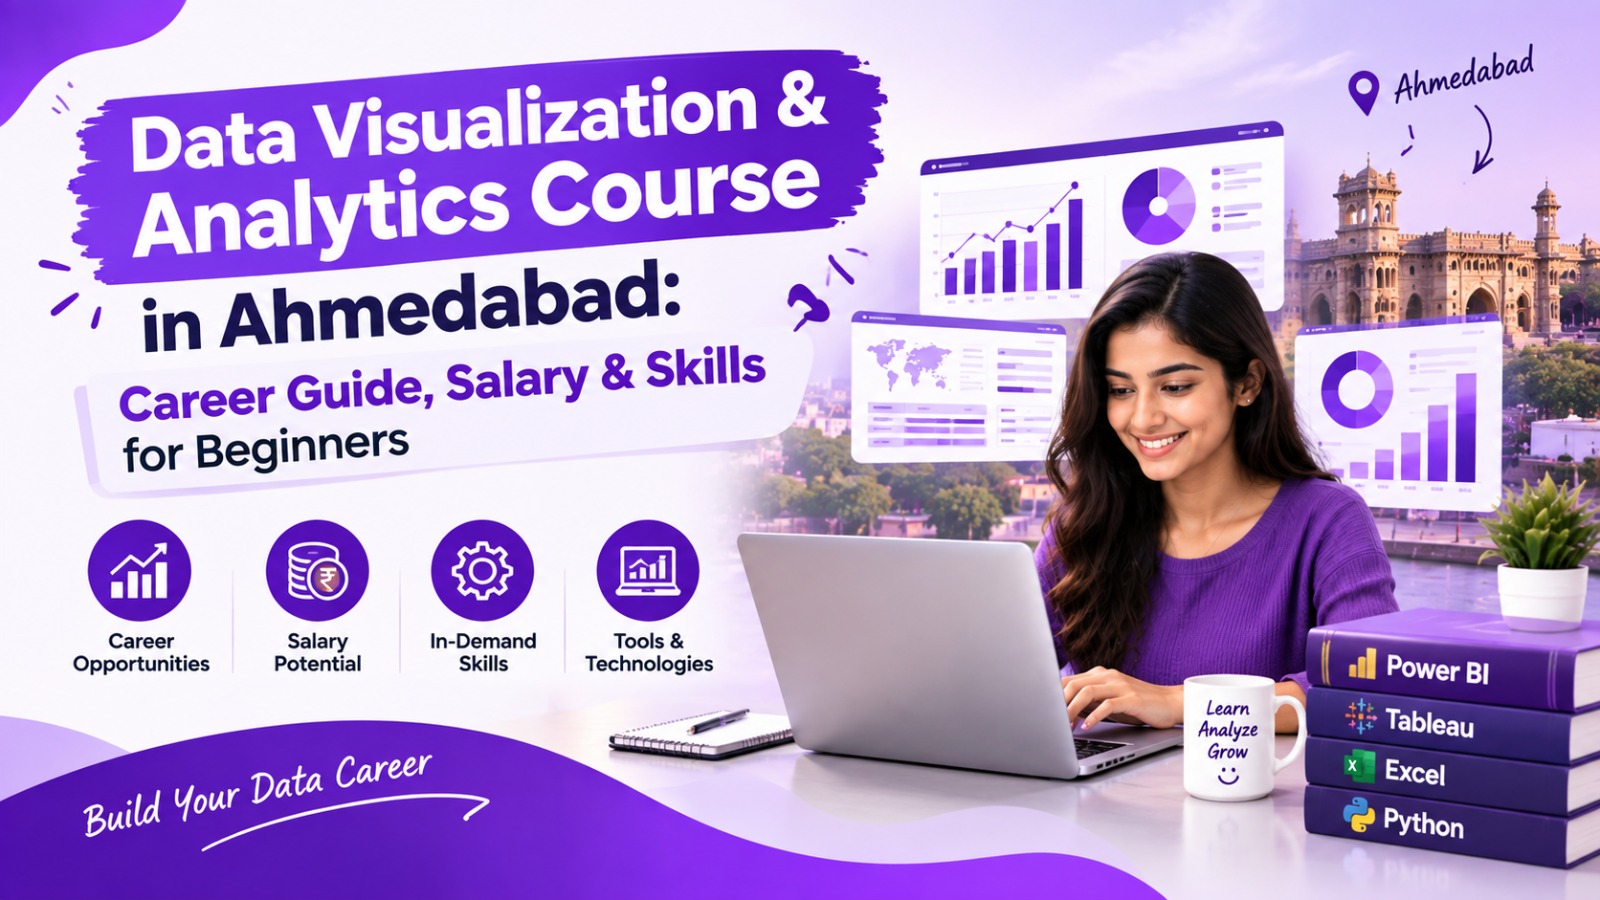
Data Visualization & Analytics Course in Ahmedabad: Career Guide, Salary & Skills for Beginners

Data is now an important part of decision-making across industries. Companies use data to understand customers, monitor business performance, identify trends, reduce costs, and plan future strategies. As a result, professionals who can analyse data and present it through clear visualizations are increasingly valuable. A Data Visualization & Analytics Course in Ahmedabad can help beginners […]

Recent Comments

No comments to show.
X