
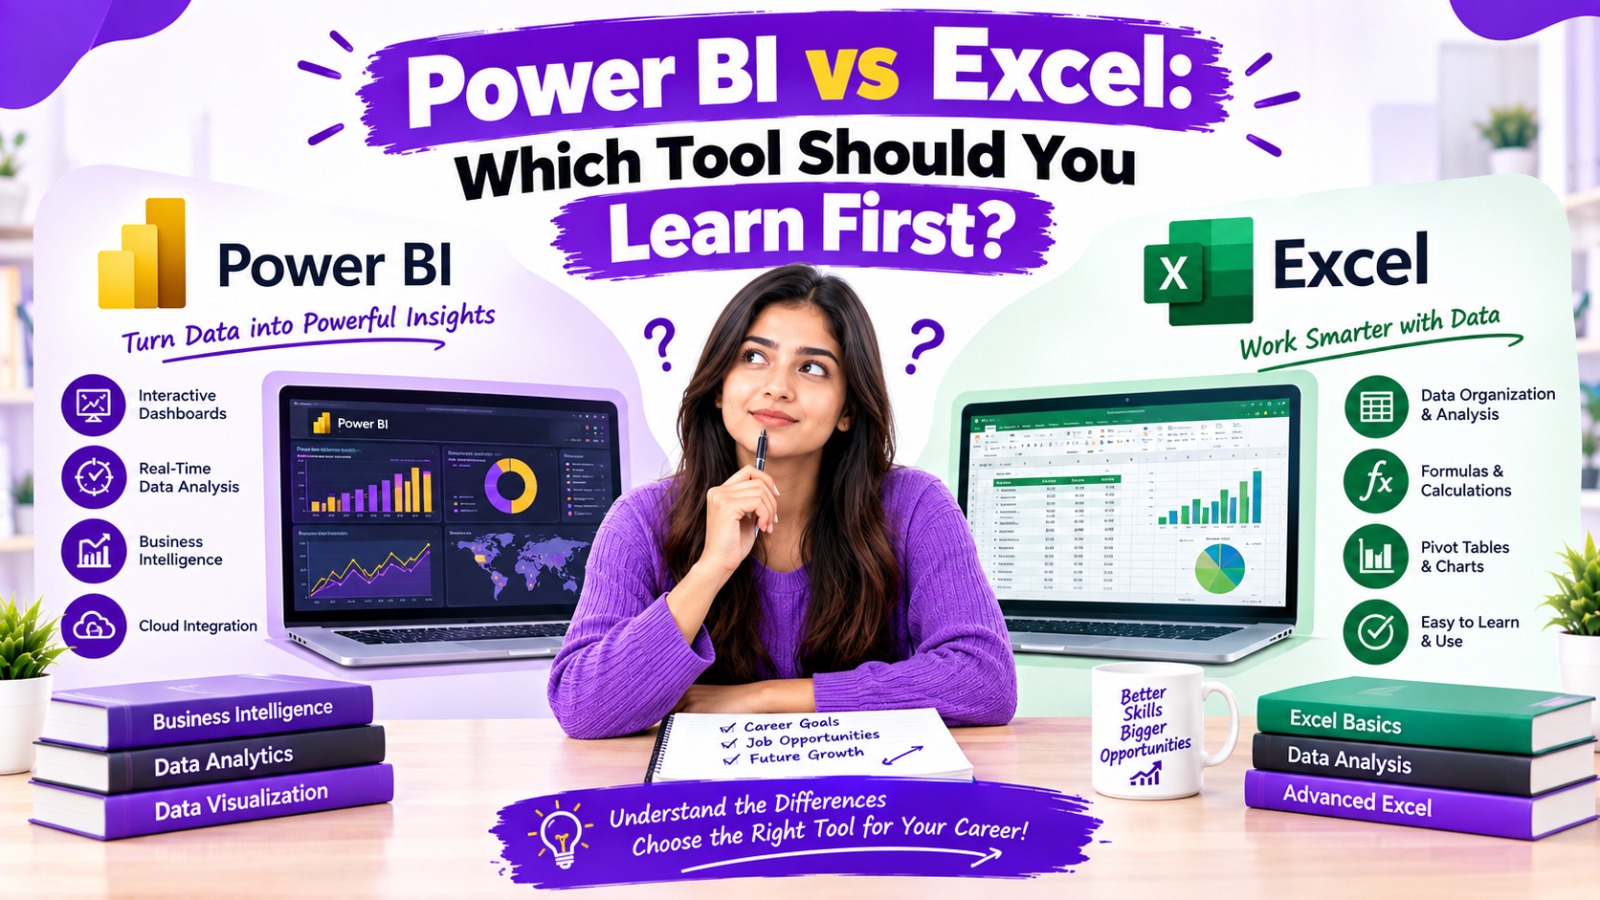
Data is now an important part of almost every business.
Companies use data to understand sales, customers, finances, marketing performance, inventory, operations, employee information, and business growth.
As organizations become more data-driven, professionals are expected to work with spreadsheets, reports, dashboards, and analytics tools.
Two tools that frequently appear in this area are Microsoft Excel and Microsoft Power BI.
This leads many beginners to ask:
Should I learn Excel first or Power BI?
The answer depends on what you want to do with data.
Excel and Power BI are not exactly competing tools. They can perform some similar tasks, but they are designed for different types of workflows.
Excel is a highly flexible spreadsheet application used for calculations, data management, analysis, reporting, and many other tasks.
Power BI is a business intelligence platform designed for connecting data sources, transforming data, building models, creating interactive reports, and sharing dashboards.
Understanding the difference can help students and working professionals choose a suitable learning path.
What Is Microsoft Excel?
Microsoft Excel is a spreadsheet application widely used for organizing, calculating, analyzing, and presenting information.
It allows users to work with data in rows and columns and provides functions for calculations and analysis.
Common Excel features include:
- Formulas
- Functions
- Sorting
- Filtering
- Conditional formatting
- Tables
- PivotTables
- PivotCharts
- Charts
- Data validation
- Power Query
- Basic dashboards
Excel is used across departments such as finance, sales, HR, marketing, administration, operations, and accounting.
What Is Microsoft Power BI?
Microsoft Power BI is a business intelligence and analytics platform used to connect to data, transform it, analyze it, and create interactive reports and dashboards.
Power BI can connect to multiple sources and combine information into a data model.
Common Power BI capabilities include:
- Data importing
- Data transformation
- Data modeling
- Interactive dashboards
- Reports
- Data visualization
- DAX calculations
- Filters and slicers
- Drill-down analysis
- Data refresh
- Sharing and collaboration
Power BI is commonly associated with business intelligence and data analytics workflows.
Power BI vs Excel: Basic Difference
The easiest way to understand the difference is:
Excel is primarily a spreadsheet and analysis tool, while Power BI is primarily a business intelligence and reporting platform.
Excel is particularly useful when you need to:
- Work directly with cells
- Perform calculations
- Create spreadsheets
- Analyze smaller or moderately sized datasets
- Build flexible reports
- Perform ad-hoc analysis
Power BI is particularly useful when you need to:
- Build interactive dashboards
- Combine multiple data sources
- Create data models
- Build reusable reports
- Monitor KPIs
- Share business intelligence reports
- Work with larger analytical workflows
Power BI vs Excel Comparison
| Feature | Excel | Power BI |
|---|---|---|
| Main purpose | Spreadsheet, calculations and analysis | Business intelligence and reporting |
| Data entry | Strong | Limited compared with Excel |
| Formulas | Extensive | Uses DAX for analytical calculations |
| Charts | Yes | Yes |
| Interactive dashboards | Possible | Strong |
| PivotTables | Yes | Similar analytical concepts through visuals |
| Data modeling | Available through Power Pivot | Core capability |
| Multiple data sources | Yes | Strong integration |
| Data transformation | Power Query | Power Query |
| Data visualization | Good | Strong |
| Large analytical datasets | Has limitations depending on setup | Designed for analytical workloads |
| Ad-hoc analysis | Very convenient | Less spreadsheet-oriented |
| Automation | VBA, Office Scripts and other features | Data refresh, Power Automate integration and other options |
| Business intelligence | Possible | Core purpose |
| Learning curve | Beginner-friendly | Requires additional concepts |
| Best suited for | Spreadsheet analysis and flexible calculations | Dashboards, BI and interactive reporting |
Excel vs Power BI: Which Is Easier to Learn?
For most beginners, Excel can be easier to start with.
You can begin with simple tasks such as:
- Entering data
- Formatting cells
- Using SUM
- Using AVERAGE
- Sorting data
- Filtering data
- Creating basic charts
You can gradually move to:
- IF functions
- XLOOKUP
- PivotTables
- Power Query
- Advanced formulas
- Dashboards
Power BI requires understanding several additional concepts.
For example:
- Data sources
- Data transformation
- Relationships
- Data modeling
- Measures
- DAX
- Report pages
- Filters
- Slicers
- Dashboard design
This does not mean Power BI is too difficult.
It means the learning process is different.
Someone familiar with Excel and basic data analysis may find Power BI concepts easier to understand.
Why Should Beginners Learn Excel?
Excel provides a foundation for understanding data.
When learning Excel, beginners can develop important skills such as:
Understanding Rows and Columns
You learn how structured data is organized.
Learning Formulas
Formulas teach you how calculations work.
Using Functions
Functions help automate common calculations.
Examples include:
- SUM
- AVERAGE
- COUNT
- IF
- SUMIF
- COUNTIF
- XLOOKUP
Sorting and Filtering
These features teach you how to examine specific parts of a dataset.
PivotTables
PivotTables introduce concepts such as grouping, summarization, and aggregation.
Charts
Charts provide a basic introduction to data visualization.
These concepts can later support your transition into more advanced analytics tools.
Why Should You Learn Power BI?
Power BI becomes particularly useful when your work moves beyond traditional spreadsheets.
You can use Power BI to create interactive reports where users can:
- Filter information
- Select different categories
- Explore trends
- View KPIs
- Drill into details
- Compare performance
- Analyze multiple dimensions
For example, a sales dashboard could allow a manager to select:
Year → Region → Product → Salesperson
and dynamically view the relevant information.
This type of interactive reporting is one of Power BI’s major strengths.
Excel vs Power BI for Data Analysis
Both tools can analyze data, but the workflow can be different.
Excel
Excel is useful for:
- Quick calculations
- Manual analysis
- Ad-hoc reporting
- Spreadsheet-based workflows
- Formula-based analysis
- Small to moderately sized datasets
- Flexible data manipulation
Power BI
Power BI is useful for:
- Interactive reports
- Business intelligence
- Dashboard development
- Data modeling
- Multiple data sources
- Reusable reports
- KPI monitoring
- More structured analytical workflows
In many organizations, professionals use both rather than choosing only one.
Power BI vs Excel for Data Visualization
Both tools provide charts and visualizations.
Excel can create:
- Bar charts
- Column charts
- Line charts
- Pie charts
- Area charts
- Scatter charts
- PivotCharts
Power BI provides a broader dashboard-oriented environment with interactive visualizations, slicers, filters, drill-through functionality, and other reporting capabilities.
If you need a quick chart inside a spreadsheet, Excel can be very convenient.
If you need an interactive business dashboard that users can explore, Power BI may be more appropriate.
Power BI vs Excel for Dashboards
Excel can be used to create dashboards.
For example, an Excel dashboard can contain:
- KPI cards
- Charts
- PivotTables
- Slicers
- Tables
- Conditional formatting
However, Power BI is specifically designed around interactive reporting and business intelligence.
A Power BI dashboard or report can combine multiple visuals and data sources and allow users to interact with the information.
This makes Power BI particularly relevant for professionals interested in business intelligence and analytics.
Power BI vs Excel for Large Data
Excel can work with substantial datasets, but it is still fundamentally a spreadsheet application and has worksheet and workbook constraints.
Power BI is designed around analytical data models and can be better suited to workflows involving larger datasets and multiple data sources.
The actual performance and suitable tool depend on factors such as:
- Dataset size
- Data structure
- Number of data sources
- Calculations
- Model design
- Hardware
- Reporting requirements
Therefore, “large data” should not be understood as a simple fixed number where one tool automatically becomes better.
Power BI vs Excel for Multiple Data Sources
Suppose a company has information stored in:
- Excel files
- CSV files
- SQL databases
- Cloud services
- CRM systems
Power BI can connect to multiple sources and bring them into a data model.
Excel can also connect to and transform data using tools such as Power Query and Power Pivot.
The difference is that Power BI is built around the business intelligence workflow, while Excel remains more spreadsheet-oriented.
Power Query: A Skill Useful in Both Excel and Power BI
One important connection between Excel and Power BI is Power Query.
Power Query helps users:
- Import data
- Remove unnecessary columns
- Change data types
- Remove duplicates
- Combine datasets
- Filter data
- Split columns
- Merge queries
- Transform data
Learning Power Query can therefore be useful whether you plan to work mainly with Excel or Power BI.
DAX: An Important Power BI Skill
DAX stands for Data Analysis Expressions.
It is a formula language used in Power BI and other Microsoft analytical technologies.
DAX is commonly used to create:
- Measures
- Calculated columns
- Calculated tables
- Time-based calculations
- Business metrics
For example, a Power BI report may use DAX to calculate:
- Total sales
- Profit margin
- Year-over-year growth
- Percentage contribution
- Running totals
Beginners do not need to master DAX immediately.
It is better to first understand basic data analysis and Power BI concepts before moving into advanced DAX.
Which Tool Is More Useful for Jobs?
This depends on the job.
Different roles may emphasize different skills.
Excel Is Commonly Used In
- Accounting
- Finance
- Administration
- Sales
- HR
- Operations
- Marketing
- Business reporting
- Office administration
Power BI Is Commonly Associated With
- Data analytics
- Business intelligence
- Reporting
- Management dashboards
- Business analysis
- Performance reporting
- Data-driven decision support
In many job roles, knowing both can be useful.
Excel and Power BI Together
Instead of thinking:
Excel OR Power BI
it can be more useful to think:
Excel + Power BI
For example, a professional might use:
Excel → Data preparation → Power Query → Power BI → Dashboard → Business insights
Excel can be used for quick analysis and spreadsheet work, while Power BI can be used for interactive reporting and dashboard development.
These tools can complement each other.
Should Students Learn Excel or Power BI First?
For students who are completely new to data analysis, a practical progression can be:
Excel Fundamentals
Learn:
- Spreadsheet basics
- Formatting
- Formulas
- Functions
- Sorting
- Filtering
Then move to:
Excel Data Analysis
Learn:
- XLOOKUP
- IF functions
- SUMIFS
- COUNTIFS
- PivotTables
- PivotCharts
- Conditional formatting
Then:
Power Query
Learn how to clean and transform data.
Then:
Power BI
Learn:
- Data import
- Power Query
- Data modeling
- Relationships
- Visualizations
- Filters
- Slicers
- DAX
- Dashboard creation
Finally:
SQL + Statistics + Advanced Analytics
This creates a broader data analytics foundation.
Can You Learn Power BI Without Excel?
Yes.
You can learn Power BI without becoming an advanced Excel user.
However, basic Excel knowledge can make the transition easier because many data concepts are familiar.
If your goal is specifically Power BI or business intelligence, you can start Power BI relatively early while learning Excel fundamentals alongside it.
You do not need to wait until you become an Excel expert.
Can You Get a Data Analyst Job With Excel Alone?
Excel is an important skill for many analytical and reporting roles, but data analyst positions often require a broader skill set.
Depending on the role, employers may look for skills such as:
- Excel
- SQL
- Power BI or Tableau
- Statistics
- Data cleaning
- Data visualization
- Business understanding
- Communication
Therefore, Excel can be an excellent foundation, but learning additional analytical skills can expand the types of roles you can target.
What Should You Learn After Excel and Power BI?
Once you are comfortable with Excel and Power BI, consider learning:
SQL
SQL is important for retrieving and analyzing data stored in relational databases.
Statistics
Basic statistics helps you understand data more accurately.
Important concepts include:
- Mean
- Median
- Mode
- Percentage
- Distribution
- Standard deviation
- Correlation
- Probability
Data Cleaning
Learn how to identify and correct:
- Missing data
- Duplicates
- Incorrect formats
- Inconsistent values
Data Modeling
Understand:
- Tables
- Relationships
- Keys
- Dimensions
- Facts
Data Storytelling
Learn how to communicate insights clearly rather than simply presenting charts.
Which Is Better for a Career: Excel or Power BI?
There is no universal answer because the tools support different types of work.
Excel is highly relevant for professionals who work extensively with spreadsheets, calculations, financial models, operational reports, and ad-hoc analysis.
Power BI is particularly relevant for professionals interested in business intelligence, interactive reporting, dashboards, and structured data analysis.
For someone building a broader data analytics skill set, learning both can provide complementary capabilities.
Power BI and Excel Course Options in Ahmedabad
Students and working professionals in Ahmedabad who want to develop data analytics skills can look for courses that provide practical training rather than focusing only on software features.
A useful curriculum may include:
Excel
- Basic Excel
- Advanced Excel
- Formulas
- Functions
- PivotTables
- Charts
- Power Query
Power BI
- Data import
- Data cleaning
- Power Query
- Data modeling
- DAX
- Visualizations
- Dashboard creation
- Interactive reports
Additional Analytics Skills
- SQL
- Statistics
- Data interpretation
- Data storytelling
- Practical projects
A Power BI course in Ahmedabad, Advanced Excel course in Ahmedabad, or broader data analytics course in Ahmedabad can be considered depending on your current skill level and career objective.
Practical Projects to Learn Excel and Power BI
The best way to learn these tools is through practical datasets.
Sales Analysis Project
Use data containing:
- Product
- Customer
- Region
- Sales
- Quantity
- Profit
- Date
Create an Excel analysis and then build a Power BI dashboard.
HR Analytics Project
Analyze:
- Employees
- Departments
- Salary
- Attendance
- Hiring
- Attrition
Create charts and KPIs.
Marketing Analytics Project
Analyze:
- Campaign
- Budget
- Clicks
- Leads
- Conversions
- Cost
Build a marketing performance dashboard.
E-Commerce Project
Analyze:
- Orders
- Products
- Revenue
- Customers
- Categories
- Locations
Use Excel for initial analysis and Power BI for interactive reporting.
Common Mistakes When Choosing Between Excel and Power BI
Thinking Power BI Replaces Excel Completely
Power BI and Excel have overlapping capabilities, but they serve different purposes.
Learning Tools Without Understanding Data
Knowing where to click is not the same as knowing how to analyze data.
Understand the business question first.
Starting With Advanced DAX Too Early
Beginners can become overwhelmed by DAX if they have not yet understood basic data modeling and analysis.
Ignoring Excel
Even if your long-term goal is Power BI, Excel remains useful in many workplaces.
Learning Without Projects
Watching tutorials without practicing can make it difficult to apply skills in real work.
Recommended Learning Path for Beginners
A practical learning path can look like this:
Excel Basics
↓
Excel Formulas & Functions
↓
PivotTables & Charts
↓
Advanced Excel
↓
Power Query
↓
Power BI Fundamentals
↓
Data Modeling
↓
DAX
↓
Interactive Dashboards
↓
SQL
↓
Statistics & Data Analysis
↓
Real-World Projects
This progression can help beginners build their skills gradually.
Frequently Asked Questions
Is Power BI better than Excel?
Power BI and Excel are designed for different purposes. Excel is a flexible spreadsheet and analysis tool, while Power BI is focused on business intelligence, interactive reporting, and dashboards.
Should I learn Excel before Power BI?
For complete beginners, learning Excel fundamentals first can provide a useful foundation. However, you can also begin Power BI relatively early if your primary goal is business intelligence and dashboard development.
Can I learn Power BI without knowing Excel?
Yes. Excel is not a strict prerequisite for Power BI. However, basic spreadsheet and data analysis knowledge can make Power BI concepts easier to understand.
Is Excel enough for data analysis?
Excel can perform a wide range of data analysis tasks. However, many professional data analyst roles also use SQL, Power BI or Tableau, statistics, and other analytical skills.
Is Power BI difficult for beginners?
Power BI can require more concepts than basic Excel because it involves data transformation, data modeling, relationships, visualizations, and DAX. Learning these concepts progressively can make it more manageable.
Which is better for dashboards, Excel or Power BI?
Both can create dashboards. Excel is useful for spreadsheet-based dashboards, while Power BI is designed specifically for interactive business intelligence reports and dashboards.
Which is better for large datasets?
The appropriate tool depends on the dataset and analytical workflow. Power BI is designed for analytical data models and can be well suited to larger business intelligence workloads, while Excel has spreadsheet-specific limitations.
Which has better career scope, Excel or Power BI?
Both can contribute to different career paths. Excel is widely used across business functions, while Power BI is particularly relevant to business intelligence, reporting, and data analytics roles.
Should I learn Excel, Power BI, and SQL?
Learning all three can create a useful foundation for many data-related roles. Excel supports spreadsheet analysis, Power BI supports visualization and business intelligence, and SQL helps retrieve and analyze database data.
Can a non-technical person learn Power BI?
Yes. Power BI can be learned by people from non-technical backgrounds. Starting with Excel, basic data concepts, and simple dashboards can make the learning process easier.
Which should I learn first for a data analyst career?
A practical path for many beginners is Excel fundamentals → data analysis → Power BI → SQL → statistics → projects. The exact order can be adjusted according to your background and target role.
Conclusion
The choice between Power BI and Excel does not have to be an either-or decision.
Excel provides a strong foundation for spreadsheet management, calculations, formulas, data analysis, PivotTables, and basic visualization.
Power BI extends the analytical workflow into interactive reporting, data modeling, business intelligence, and dashboard development.
For someone completely new to data analysis, starting with Excel fundamentals can provide a useful foundation before progressing to Power BI.
For learners whose immediate goal is business intelligence and interactive dashboards, Power BI can be introduced early alongside basic Excel knowledge.
A broader data analytics learning path can eventually combine:
Excel + Power BI + SQL + Statistics + Data Visualization + Data Analysis + Business Understanding
The most important thing is not simply learning the software. It is learning how to use data to answer questions, identify patterns, communicate insights, and support business decisions.
For students and working professionals in Ahmedabad and Gujarat, developing both Excel and Power BI skills can provide a practical foundation for exploring careers in data analytics, business intelligence, reporting, business analysis, finance analytics, marketing analytics, and operations analytics.