
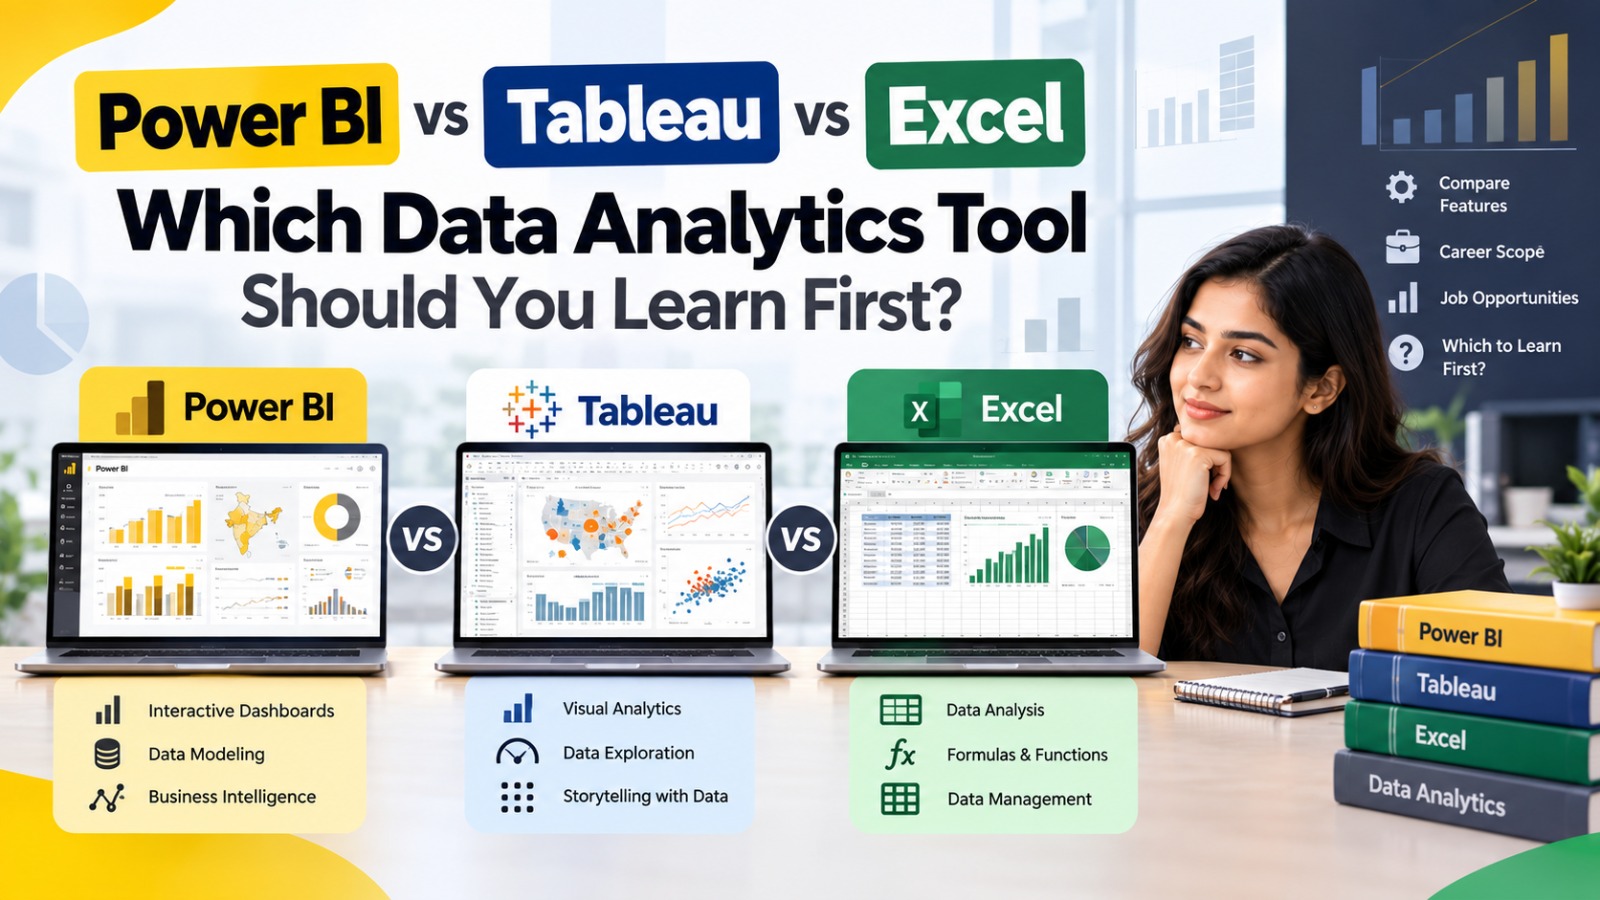
Excel, Power BI, and Tableau are three widely used tools for working with data, but they serve somewhat different purposes.
Excel is a spreadsheet and data analysis tool that is particularly useful for beginners, calculations, data cleaning, reporting, and smaller datasets.
Power BI is a business intelligence and visualization platform designed for interactive dashboards, data modelling, reporting, and connecting data from multiple sources.
Tableau is a data visualization and business intelligence platform known for interactive visual analysis and dashboard development.
For someone starting a career in data analytics, the question is not simply which tool is “best.” The better question is which tool should you learn first based on your current skill level and career goal?
This guide compares Power BI, Tableau, and Excel and explains a practical learning sequence for beginners.
What Are Excel, Power BI, and Tableau?
Before comparing them, it is important to understand what each tool does.
What Is Excel?
Microsoft Excel is a spreadsheet application used for:
- Calculations
- Data entry
- Data cleaning
- Data analysis
- Reporting
- Charts
- Pivot Tables
- Financial modelling
- Basic dashboards
Excel is commonly used across departments such as finance, sales, HR, marketing, operations, and administration.
For beginners, Excel provides a relatively accessible introduction to working with structured data.
What Is Power BI?
Microsoft Power BI is a business intelligence platform used to connect, transform, model, analyse, and visualize data.
It can be used to create interactive:
- Dashboards
- Reports
- Charts
- KPI cards
- Tables
- Maps
- Business reports
Power BI can connect with various data sources and allows users to combine information into interactive analytical reports.
It is particularly useful when an organization needs recurring reports and dashboards rather than manually creating the same report in a spreadsheet.
What Is Tableau?
Tableau is a business intelligence and data visualization platform designed to help users explore and present data visually.
Tableau supports:
- Interactive dashboards
- Data visualization
- Data exploration
- Business reporting
- Data connections
- Calculated fields
- Filters
- Interactive analysis
It is commonly associated with visual analytics and dashboard development.
Power BI vs Tableau vs Excel: Quick Comparison
| Feature | Excel | Power BI | Tableau |
|---|---|---|---|
| Beginner-friendly | High | High to Medium | Medium |
| Spreadsheet calculations | Excellent | Limited compared with Excel | Limited compared with Excel |
| Data cleaning | Good | Very Good | Good |
| Interactive dashboards | Basic to Moderate | Excellent | Excellent |
| Data visualization | Good | Excellent | Excellent |
| Large datasets | More limited | Strong | Strong |
| Data modelling | Basic | Strong | Strong |
| SQL integration | Possible | Strong | Strong |
| Advanced visualization | Moderate | Strong | Very Strong |
| Business reporting | Excellent | Excellent | Excellent |
| Learning curve | Lower | Moderate | Moderate |
| Best starting point | Beginners | Analytics/BI | Visualization/BI |
| Main strength | Spreadsheet analysis | BI & dashboards | Visual analytics |
The exact capabilities depend on the product version, data source, deployment environment, and use case.
Excel vs Power BI vs Tableau: Main Difference
The simplest way to understand the difference is:
Excel → Spreadsheet-based analysis
Power BI → Business intelligence and interactive reporting
Tableau → Visual analytics and interactive data exploration
There is considerable overlap between the three, so they should not be viewed as completely separate categories.
Excel for Data Analytics
Excel can be a strong starting point for someone who has never worked with data.
What Can You Do With Excel?
You can use Excel to:
- Organize datasets
- Clean data
- Calculate metrics
- Apply formulas
- Create Pivot Tables
- Build charts
- Analyse trends
- Create reports
- Perform basic statistical analysis
- Build simple dashboards
Important Excel Skills for Analytics
Beginners should consider learning:
- SUM
- AVERAGE
- COUNT
- IF
- SUMIF
- SUMIFS
- COUNTIF
- COUNTIFS
- XLOOKUP
- VLOOKUP
- INDEX & MATCH
- Conditional Formatting
- Data Validation
- Sorting and Filtering
- Pivot Tables
- Pivot Charts
- Basic dashboard creation
Advanced Excel users can also explore Power Query and Power Pivot.
Advantages of Excel
Excel is useful because:
- It is familiar to many professionals.
- It is relatively easy to start with.
- It is useful for calculations.
- It works well for many business reporting tasks.
- It supports Pivot Tables and charts.
- It is widely used across different business functions.
Limitations of Excel
Excel can become less convenient when:
- Data volumes become very large.
- Multiple data sources need to be combined regularly.
- Dashboards need frequent automated refreshes.
- Many users need to interact with centralized reports.
- Complex data models are required.
This does not mean Excel becomes useless. Instead, another analytics or BI platform may be more suitable for particular requirements.
Power BI for Data Analytics
Power BI becomes particularly useful when you move beyond individual spreadsheets into interactive business intelligence.
What Can You Do With Power BI?
Power BI can help you:
- Connect multiple data sources
- Clean and transform data
- Create data models
- Build relationships between tables
- Create calculated measures
- Build interactive dashboards
- Create reports
- Apply filters and slicers
- Track KPIs
- Share analytical reports
Important Power BI Skills
A beginner learning Power BI should understand:
Power Query
Used for importing, cleaning, and transforming data.
Data Modelling
Used to structure relationships between different tables.
DAX
Data Analysis Expressions (DAX) is used to create calculations and measures.
Visualizations
Learn how to use:
- Bar charts
- Line charts
- Tables
- Cards
- Maps
- Matrix visuals
- KPI visuals
- Slicers
Dashboard Design
Learn how to arrange information so users can quickly understand important business metrics.
Advantages of Power BI
Power BI is useful for:
- Interactive dashboards
- Business reporting
- Combining multiple data sources
- Data transformation
- Data modelling
- KPI reporting
- Recurring reports
- Business intelligence workflows
For someone planning to work in business reporting or business intelligence, Power BI can be an important skill.
Limitations of Power BI
Power BI has a learning curve.
Beginners may need time to understand:
- Power Query
- Data modelling
- Relationships
- DAX
- Report design
- Power BI Service
- Data refresh concepts
Learning only how to drag charts onto a page is not enough to become proficient in Power BI.
Tableau for Data Analytics
Tableau focuses heavily on visual analytics and interactive data exploration.
What Can You Do With Tableau?
Tableau can be used to:
- Connect to data
- Explore datasets
- Create visualizations
- Build dashboards
- Create calculated fields
- Apply filters
- Analyse trends
- Create interactive reports
Tableau can be particularly useful when users need to explore data visually and communicate insights through dashboards.
Important Tableau Skills
Beginners can learn:
- Tableau interface
- Dimensions and measures
- Data connections
- Filters
- Calculated fields
- Parameters
- Charts
- Dashboards
- Stories
- Interactive visualizations
- Dashboard design
Advantages of Tableau
Tableau is known for:
- Strong visualization capabilities
- Interactive dashboards
- Visual exploration
- Flexible analytical views
- A broad range of visualization options
Limitations of Tableau
For beginners, Tableau can require time to understand:
- Dimensions and measures
- Calculated fields
- Data relationships
- Dashboard design
- Advanced analytics features
- Tableau’s broader ecosystem
For simple spreadsheet calculations, Excel may be more straightforward.
Power BI vs Tableau
Power BI and Tableau overlap significantly because both are business intelligence and visualization platforms.
However, there are differences in their ecosystems and workflows.
| Area | Power BI | Tableau |
|---|---|---|
| Main focus | BI, reporting & dashboards | Visual analytics & dashboards |
| Microsoft ecosystem | Strong integration | Available across ecosystems |
| Dashboard creation | Strong | Strong |
| Visualization | Strong | Strong |
| Data modelling | Strong | Strong |
| DAX | Yes | No |
| Power Query | Yes | No |
| Visual exploration | Strong | Strong |
| Beginner learning | Moderate | Moderate |
| Enterprise use | Widely used | Widely used |
Neither tool should automatically be considered universally better. The appropriate choice depends on the organization’s technology environment, job requirements, data sources, and user’s goals.
Excel vs Power BI
Excel and Power BI can work together rather than being direct replacements.
For example:
Excel:
Clean a dataset → analyse data → create Pivot Tables → prepare a report.
Power BI:
Connect data → transform it → build a model → create interactive dashboards → publish and share reports.
Someone who already knows Excel may find some Power BI concepts easier to understand because both are part of Microsoft’s broader data ecosystem.
Excel vs Tableau
Excel is primarily a spreadsheet application, while Tableau is focused more heavily on visual analytics and interactive dashboards.
Excel is useful when you need:
- Calculations
- Tables
- Formulas
- Quick analysis
- Spreadsheet-based reporting
Tableau is useful when you need:
- Interactive visualizations
- Visual exploration
- Dashboards
- Data storytelling
- Business analytics
They can also be used together in some workflows.
Which Tool Should a Beginner Learn First?
For many complete beginners, Excel is a practical starting point because it introduces fundamental concepts such as:
- Rows and columns
- Data types
- Formulas
- Calculations
- Sorting
- Filtering
- Data cleaning
- Pivot Tables
- Charts
After building these fundamentals, you can move to a dedicated BI tool.
A practical sequence is:
Beginner Path
Excel → SQL → Power BI → Projects → Advanced Analytics
This is not the only valid learning path.
If your specific career target requires Tableau, you can learn Tableau instead of or alongside Power BI.
Should You Learn Power BI or Tableau After Excel?
This depends on your career goals and the tools commonly requested in the jobs you want.
Choose Power BI if you want to focus on:
- Business intelligence
- Business reporting
- Dashboard development
- Microsoft-based environments
- Power Query
- DAX
- Data modelling
Choose Tableau if you want to focus on:
- Visual analytics
- Interactive dashboards
- Data exploration
- Data storytelling
- Tableau-specific analytics roles
Before choosing, check current job descriptions in your target location and industry to see which skills employers are requesting.
Do You Need to Learn All Three?
No.
You do not need to master Excel, Power BI, and Tableau simultaneously before applying for entry-level roles.
A better approach is to:
Build strong fundamentals → become proficient in one BI tool → develop projects → add another tool later if needed.
For example:
Excel + SQL + Power BI
can form a practical beginner analytics toolkit.
Later, you can add:
Tableau + Python + advanced SQL
depending on your career direction.
Which Tool Is Easiest to Learn?
For most beginners, Excel has the gentlest starting curve because its spreadsheet structure is familiar and its basic functions can be learned incrementally.
Power BI and Tableau generally require additional concepts related to data modelling, visualization, dashboards, and business intelligence.
However, the difficulty depends on your previous experience.
Someone already familiar with Excel may find Power BI easier to approach than someone starting from zero.
Which Tool Is Best for Dashboards?
Both Power BI and Tableau are designed for interactive dashboards.
Excel can also create dashboards, but its dashboard capabilities are generally more spreadsheet-oriented.
If your primary goal is learning interactive business dashboards, focus on a dedicated BI platform such as Power BI or Tableau.
Which Tool Is Best for Data Visualization?
Power BI and Tableau both provide extensive visualization capabilities.
Tableau has a strong focus on visual exploration and analytical visualization, while Power BI combines visualization with Microsoft’s broader business intelligence ecosystem.
The better fit depends on the type of work you want to perform and the technology environment of the organization.
Which Tool Is Best for Data Analytics Jobs?
There is no single tool that guarantees employment.
Job requirements vary by:
- Company
- Industry
- Role
- Location
- Experience
- Technology stack
A beginner should therefore focus on a combination of skills rather than learning one tool in isolation.
A practical foundation is:
Excel + SQL + Power BI/Tableau + Statistics + Data Visualization + Communication
Power BI, Tableau & Excel Learning Roadmap
If you are starting from zero, follow a structured sequence.
Stage 1: Learn Data Fundamentals
Understand:
- What is data?
- What is a dataset?
- Rows and columns
- Data types
- Metrics
- Dimensions
- KPIs
- Basic statistics
Stage 2: Learn Excel
Focus on:
- Formulas
- Functions
- Data cleaning
- Sorting
- Filtering
- Pivot Tables
- Charts
- Basic dashboards
Stage 3: Learn SQL
Learn:
- SELECT
- WHERE
- GROUP BY
- ORDER BY
- JOIN
- Aggregate functions
- CASE
- Subqueries
Stage 4: Choose Power BI or Tableau
Learn one tool properly instead of trying to learn both at once.
Stage 5: Build Projects
Create:
- Sales dashboard
- Customer analysis
- Marketing dashboard
- Financial report
- HR analytics dashboard
Stage 6: Build a Portfolio
Show:
- Problem
- Dataset
- Cleaning process
- Analysis
- Dashboard
- Key findings
Stage 7: Prepare for Jobs
Work on:
- Resume
- Portfolio
- Interview questions
- SQL exercises
- Excel exercises
- Dashboard presentations
- Communication skills
Example: Which Tool Would You Use?
Imagine a company has one year of sales data.
Task 1: Calculate monthly sales
Excel can be very useful.
Task 2: Clean a spreadsheet
Excel or Power Query can be used.
Task 3: Create an interactive management dashboard
Power BI or Tableau can be appropriate.
Task 4: Query customer information from a database
SQL would be useful.
Task 5: Build advanced statistical analysis
Python or specialized statistical tools may be appropriate.
This demonstrates why data analysts often use multiple tools rather than one tool for everything.
Skills Beyond Tools
Learning software alone does not make someone a strong data analyst.
You should also develop:
Analytical Thinking
Learn how to identify patterns, trends, anomalies, and relationships.
Problem Solving
Understand the business problem before starting the analysis.
Communication
Be able to explain findings to people who may not have a technical background.
Business Understanding
Know why a metric matters and how it relates to business performance.
Data Storytelling
Present important insights clearly instead of overwhelming users with charts.
Common Mistakes Beginners Make
Trying to Learn Everything at Once
Learning Excel, Power BI, Tableau, Python, SQL, and multiple other tools simultaneously can make the learning process confusing.
Start with a smaller set of skills.
Focusing Only on Certificates
A certificate can document course completion, but practical ability is demonstrated through projects, exercises, and problem-solving.
Ignoring SQL
Many analytics roles involve working with databases, so SQL can be an important skill.
Creating Attractive but Meaningless Dashboards
A dashboard should answer business questions. Visual appearance alone does not make an analysis useful.
Not Practising
Watching tutorials without working on datasets limits practical learning.
Frequently Asked Questions
Is Excel better than Power BI for beginners?
Excel can be easier for someone starting from zero because its basic spreadsheet concepts are straightforward to understand. After learning Excel fundamentals, a learner can progress to Power BI for interactive business intelligence and dashboards.
Should I learn Excel before Power BI?
For a complete beginner, learning Excel first can provide useful foundations in data handling, formulas, Pivot Tables, and basic analysis. However, someone with existing spreadsheet experience can start Power BI directly.
Is Power BI better than Tableau?
Power BI and Tableau have different strengths and are both established business intelligence and visualization platforms. The appropriate choice depends on job requirements, technology ecosystem, data sources, and the type of analytics work you want to perform.
Is Tableau easier than Power BI?
Neither is universally easier. Both require learning data connections, visualization, dashboards, and analytical concepts. Your existing experience and learning goals can affect which one feels easier.
Can I get a data analyst job with Excel only?
Excel can be useful for entry-level reporting and analysis roles, but many data analyst positions request additional skills such as SQL, Power BI, Tableau, statistics, or Python.
Do I need to learn both Power BI and Tableau?
No. Beginners can focus on one BI tool first. After becoming comfortable with one platform, learning the other can become easier.
Which is better for dashboards: Excel, Power BI, or Tableau?
Power BI and Tableau are specifically designed for interactive business intelligence dashboards. Excel can also create dashboards and reports, particularly for spreadsheet-based workflows.
Is Power BI useful for a career in data analytics?
Yes. Power BI is a widely used business intelligence and reporting platform, and learning it can help develop skills in data transformation, modelling, visualization, and dashboard creation.
Can a non-IT student learn Power BI?
Yes. A non-IT background does not prevent someone from learning Power BI. Beginners can start with Excel and basic data concepts before progressing to Power BI, SQL, and other analytics skills.
What should I learn first for a data analytics career?
A practical beginner sequence is:
Data Fundamentals → Excel → SQL → Power BI or Tableau → Projects → Portfolio → Job Preparation
Conclusion
Power BI, Tableau, and Excel are all valuable data tools, but they serve different purposes.
Excel provides a strong foundation for spreadsheet-based analysis, calculations, data cleaning, and reporting.
Power BI is well suited to interactive business intelligence, data modelling, dashboards, and recurring business reports.
Tableau provides powerful capabilities for visual analytics, interactive dashboards, and exploring data visually.
For someone starting from zero, a practical approach is to learn Excel fundamentals first, then SQL, followed by either Power BI or Tableau based on your career goals.
The most important objective is not to learn the maximum number of tools. It is to understand data, analysis, visualization, business problems, and how to communicate insights effectively.
A strong beginner combination can therefore be:
Excel + SQL + Power BI/Tableau + Statistics + Data Visualization + Analytical Thinking + Communication
With these foundations and practical projects, you can build a portfolio that demonstrates what you can actually do with data.